
Economic data evolves in a reliable sequence that can be used to understand the business cycle.
VP’s leading indicators are built from empirically leading and minimally revised economic data. We then use causal discovery processes to ensure the inputs for our indicators adapt as the world changes.


Coverage
30+ EM + DM economies
Inputs
Causal discovery selects from 250+ unique inputs, sign constrained ridge regression magnifies turning points in the data.
Maximum of ten inputs for each LEI.
Inputs change yearly, with weights updating monthly.
In 2020 markets were worried about a post COVID depression, but our inflation leading indicators were turning up across the globe.
When the Fed insisted inflation was transitory, our inflation indicators suggested otherwise, and we positioned for higher yields and higher gold prices.

Macro Snapshot Report
Summarizes the most important macro factors and our high conviction views each month.
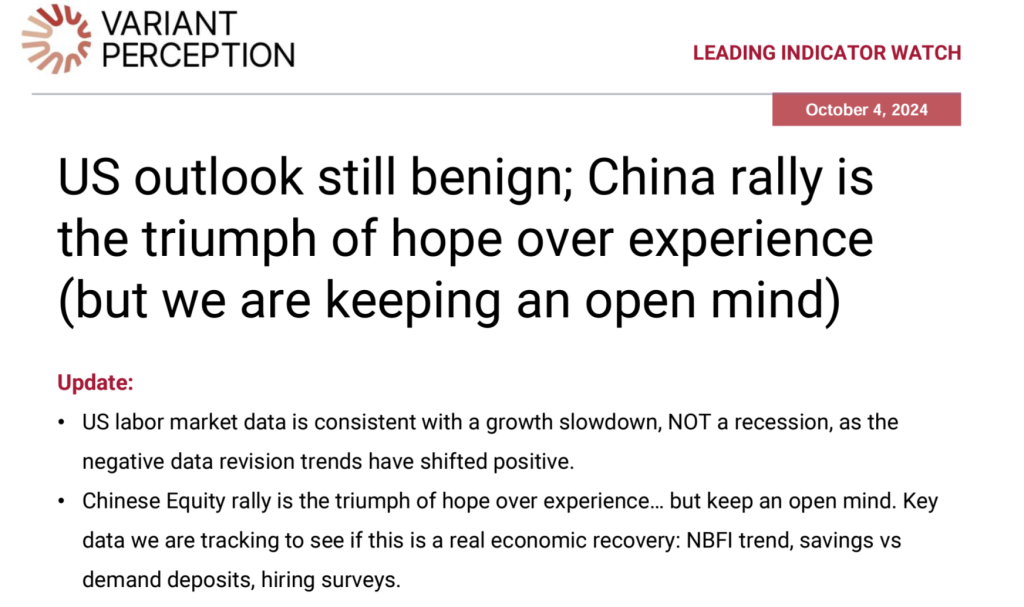
Leading Indicator Watch Report
Reviews our growth, inflation and liquidity indicators for changes in the cyclical outlook across major geographies.

Portfolio Watch Report
Reflects on market action, reviewing ideas and making tactical recommendations.